Data Analysis: Analyzing Vermont Breweries Using the Untappd API
- Introduction
- TLDR;
- Background
- Data Collection
- Data Cleaning and Organization
- Data Visualization
- Future Directions
- Conclusion (so far)
- Appendix
Introduction
Vermont is a beer mecca.
With the most breweries per-capita of the United States, and beers from the state regularly topping the charts of BeerAdvocate and Untappd, Vermont is known for its beer. I love beer, have gone through an IPA phase and left it, and live in Vermont; so I wanted to dig a little deeper into the brewery scene.
As someone who has worked as a beverage purchaser in a store known for it's beer selection, picking which beer to stock is a difficult choice. There are THOUSANDS of beers made in the state, and only so many refrigerated shelves!
It doesn't help that the dominant style (IPAs) have the shortest lifespan of any kind of beer. The biggest beers in the state strictly enforce a lifespan of 90 days; representatives come to the store to verify that you aren't selling skunked beer. This means that a bad choice can really tie up cash flow, so it's very important to stay current with trends, reputations, brewmasters, and any other information you can get your hands on.
Project Status
This is an ongoing project to visualize data retrieved about Vermont breweries and the beer they make. More charts, insights, and data sources are being investigated as you read.
TLDR;
I can be verbose (it's a blog, after all), so if you're just interested in the guts, this is a streamlined version:
- I retrieved data from Untappd on all Vermont breweries by getting a list from the Vermont Brewers Association and manually vetting
brewery_ids - Once I stored this as JSON, I used Pandas to strip the info down, normalize it, and store it in CSV format
- With this data, I made some charts:
- Bar charts of the most produced beer styles, most reviewed styles, and top 10 styles by weighted average
- A bubble chart of breweries with rating on the y axis, number of unique beers produced on the x axis, and the size of the bubble denoting the number of reviews the brewery had received
- A heatmap of beer style against ABV
- A scatterplot of breweries with rating on the x-axis and number of reviews on the y-axis
- These charts provided insights on the VT craft beer scene:
- IPAs are still the most drank/known style, but the sours & wild ales are very well reviewed as well
- Generally speaking, higher ABV beers have a higher rating
- Using the scatterplot, I was able to generate a list of breweries that were Hidden Gems, Worth the Hype, Overrated, and "Meh".
Background
Data Sources
To answer questions about Vermont breweries, I needed information on Vermont breweries. There were a couple of resources I had at my disposal:
Untappd
Nearly a decade ago, my senior college project was called BrewFind, and my team and I built a website & android app that displayed the breweries in the state and the beers they produced. We did this with the help of the Untappd API - and fortunately, my client key from this project is still valid, since they have stopped giving them out.
Untappd is a 'social drinking experience' app where people can 'check in' with a specific beer at a specific venue. Each time they check in, they can rate the beer. It's used pretty widely, and has a good collection of information on both the breweries and beers...and most importantly, I had a working API key.
Vermont Brewers Association (VBA)
The Vermont Brewers Association also has up-to-date information on the active breweries in the state, but nothing that is programmatically available.
Open Brewery Database (OBDB)
Finally, the Open Brewery Database is an open API with information self-reported by individuals out in the world.
Questions
In particular, I wanted to learn:
- What are the most dominant styles of beer (by production, rating, and review count)?
- Is there a correlation between ABV and rating?
- Is there a relationship between number of beers made by a brewery and the brewery's overall rating? What are the breweries that stand out in number of beers produced, number of ratings, number of styles, etc.
- Is there a relationship between ABV, style, and rating? Are there certain styles rated more favorably with a higher/lower ABV?
- Is there any movement away from IPAs? Is there a way I can get data to verify this?
- As a lager-head, I have plenty of anecdotal evidence that people are starting to move away from the dominance of hops, but no numbers.
These were just some of the questions I had, so I set about getting my hands on some data
Data Collection
Listing Vermont Breweries
First, I needed a list of the breweries in the state. Looking at the Untappd API, there isn't actually a way to search for breweries by location: there is just a generic query parameter that searches everything from name to state to description. Not particularly helpful.
The Open Brewery Database does have a way to filter by state, but after comparing the list retrieved to the listing on the VBA website, it was missing a lot of information.
I took the list that OBDB gave me, and manually supplemented it with the missing breweries on the VBA website. Now, to fulfill the /brewery/info query on Untappd, I needed their brewery_id for each one.
Retrieving brewery_ids
As mentioned, the /brewery/search endpoint just takes a generic q parameter, which I personally don't trust. Theoretically, I could ping the search with the name I had, and hope that the first result was the brewery I was looking for, and save the brewery_id returned - but there were cases where the brewery itself had variances in the name (Brewing Company vs Brewing Co., etc.) Also, my API key only allowed for 100 queries an hour, so I didn't want to risk nuking my attempts on something that didn't work.
With under 100 breweries, I set about getting the brewery_id from inspecting the Untappd web page for the brewery itself. I found a reliable place on the page layout where it was stored, and manually retrieved the brewery_id for each brewery I had in my list.
Now, with a CSV of all brewery names and IDs, I was able to write a python script to iterate over the list, hit the /brewery/info endpoint, store the data, then write everything out to a JSON file.
Getting Brewery Info
This mostly worked quickly, the only thing I got hung up on with briefly was that I was making my requests too quickly, and my queries got blocked. The API documentation didn't have any rate-limiting information other than 100 queries per hour, so I didn't think to throttle my requests.
In the end, I set an asyncrequestlimiter on my queries to wait a few seconds in between each request, and considering it was effectively an initialization script, I called it good.
Data Cleaning and Organization
Cleaning
The data came as JSON, and to ensure I didn't have to run the large set of throttled queries, I saved every bit of the results so I could come back to it if I needed it.
Looking at the format, it was clear that I needed to use an ETL (Extract, Transform, Load) strategy to sanitize and normalize the data before getting into it.
I first parsed through the JSON file, and made a list of brewery objects and a list of beer objects. Before either got loaded in, each field was sanitized as either a string or a number (replacing spaces & quotes, verifying as a float or int), or replaced with a default value ("" and -1).
Once created, I loaded the lists into Pandas DataFrames, and used the .any() function to look at missing data. Fortunately, it was mostly intact - just one missing column value in the whole thing (an address).
Organizing
With each brewery containing a list of beers and check-ins, and each beer/check-in containing information on the brewery, the data needed to be normalized.
I first stored brewery objects, then stripped out each beer object and kept only the brewery_id as a shared key. Once parsed, organized, and sanitized, both lists got written out to CSV files for later access.
Data Visualization
I wanted to use Pandas, Matplotlib, and Seaborn to visualize the data retrieved to see if I could get any further information to support or deny my hunches.
Bar Charts: Basic Style Information
The first set of graphs was straightforward horizontal bar charts:
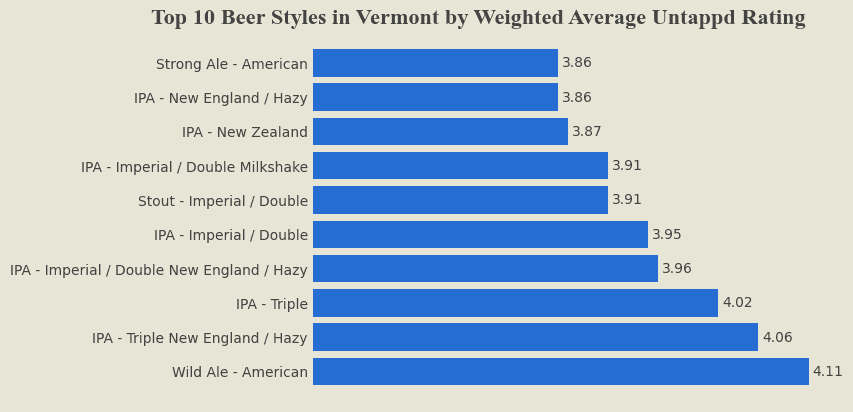
- Highest rated beer styles
- Most produced beer styles
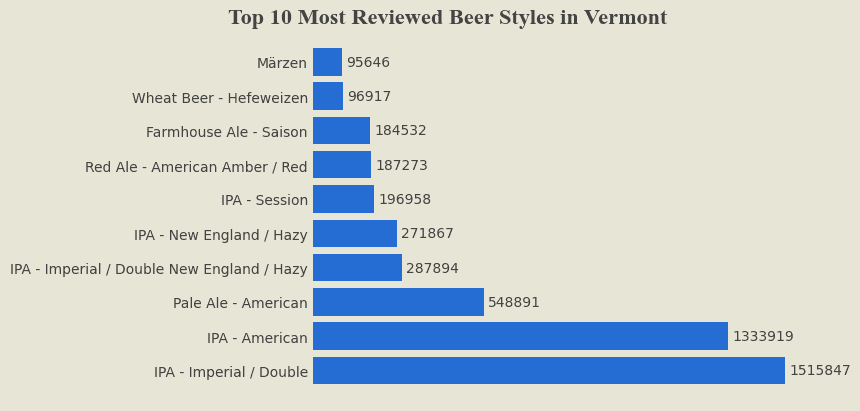
- Most reviewed beers styles
This was easy enough to do by loading in all the beer information into a DataFrame, then grouping by style and aggregating by style, rating, and number of ratings.
beer_styles = beer_df.groupby('beer_style').agg(
    Num_Beers=('beer_style', 'count'),
    Avg_Abv=('beer_abv', 'mean'),
    Avg_Ibu=('beer_ibu', 'mean'),
    Avg_Rating=('rating_score', 'mean'),
    Total_Num_Ratings=('rating_count', 'sum')
)
From there, for each type of chart I sorted by the relevant characteristic and took the top 10 values to plot.
For my bar charts, I wanted to put what I had been reading in The Visual Display of Quantitative Data by Edward Tufte, so I made a few modifications for my charts:
- I removed the frame
- I removed the default x/y ticks, and replaced them with a label at the end of each bar
Here are the charts:
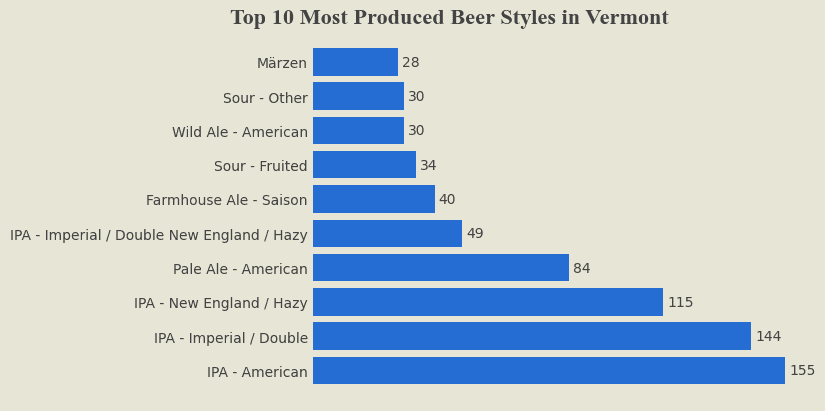
By doing this, I significantly increased the data-ink ratio on my charts, and confirmed the following information:
- There are by far more unique IPAs in the state than any other style
- IPA, IIPA, Hazy IPA, Pale Ale, and Hazy IIPA are the top 5 styles in the state by unique beers produced.
- I would like to find actual prodution numbers on these styles to see most produced by volume.
- IPAs are by far the most reviewed style.
- American Wild Ales are the highest rated style (by weighted average). All IPA styles were close behind.
The Wild Ales threw me a bit, and it only came out after I applied a weighted average instead of just the average from each beer (which was sometimes influenced by only a handful of reviews). Further digging showed that one brewery (House of Fermentology) claimed 21 of the 30 total American Wild Ales in the state...but all of them very highly rated!
Dot Dash Plot: Rating vs. Unique Beers and Number of Reviews
I made a scatter plot of breweries in the state with the number of distinct beers produced on the x-axis, and the average rating on the y-axis. To add another dimension, I made the size of the dot correlate to the number of total reviews that the brewery has received.
This would show at a glance:
- The highest rated breweries
- The breweries with the most beers made
- Outliers in either of these categories
- Rating vs number of ratings (substituting for 'popularity')
After making it, again in the spirit of Tufte, I made some small modifications:
- I removed the frame
- I replaced the x/y ticks with ticks for each point on the axis, making it a dot dash plot
- I reduced the range to only the range represented by the data
- I labeled the largest (most reviewed) dots
The chart:
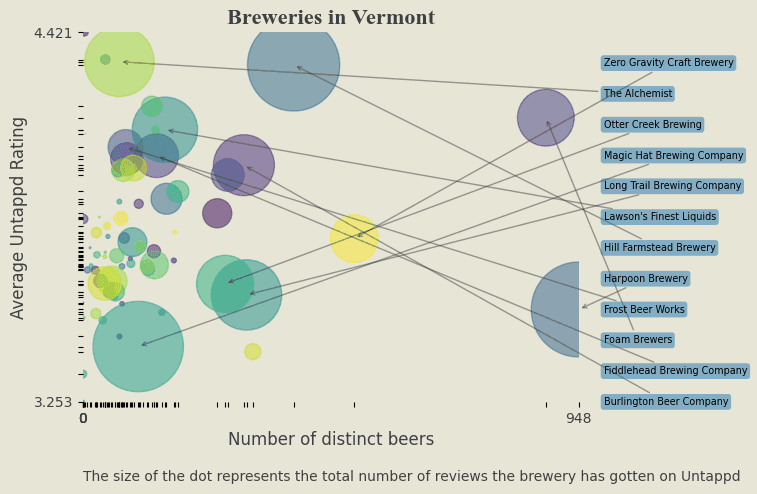
This showed a few interesting things:
- While The Alchemist is very highly rated/reviewed, it only has a very small handful of beers (famously, only 2 available outside of the tasting room). Hill Farmstead has a very similar rating, even more reviews, and FAR more distinct beers made.
- Foam Brewers have close to the MOST number of unique beers, and only slightly lower of an average review/number of reviews. Impressive!
- Harpoon claims the title for most unique beers, and has a large number of reviews, but has one of the lowest average ratings
- Almost exactly in the middle of the chart lies Zero Gravity, which feels exactly right. They're pretty solid, make a ton of seasonal beers, and are fairly well known. Right in the middle.
This is a chart that prompts more questions:
- What are some of the smaller bubbles? What are the entries with the highest ratings and lowest review counts (hidden gems)?
- What are the breweries with a low score and highest number of ratings (overrated breweries)?
I realized it would be easy enough to make a quadrant chart of rating vs number of ratings to organize the vast number of breweries in the state.
Scatterplot: Rating vs Number of Reviews
What I had in mind was creating a scatterplot of rating vs number of reviews, and dividing this into four quadrants:
- Hidden Gems: Low Number Reviews, High Rating
- Worth the Hype: High Number Reviews, High Rating
- Overrated: High Number Reviews, Low Rating
- Meh: Low Number Reviews, Low Rating
I knew what I had to do: find the median of number of reviews and rating, create a mask for each quadrant and apply it to the set to find breweries in each quadrant, change the color of the dot, and label outliers.
This basic implementation I was able to do myself, but it felt a little clunky. I was adding a 'color' column to the dataset, then plotting the whole thing, then going back and adding labels. It was a bit messy, so I fed the request into ChatGPT to see what it would do, and the result was elegant (and a good learning experience).
Instead of doing everything all at once, ChatGPT used np.where() to create a column quadrant based on the criteria, then created a dictionary of quadrant values to colors. It iterated over quadrants using a groupby, and plotted quadrants one by one, picking the color from the dictionary. Outliers were determined by a separate function, which were fed sub-frames: this was done by using a groupby and applying the function to each quadrant. Finally, the outliers were iterated over and labeled individually. So simple!
I made a few other adjustments:
- The y-axis (number of reviews) was made logarithmic: there was a lot of data clumping toward the bottom
- I used
adjustTextto prevent labels from overlapping
The chart:
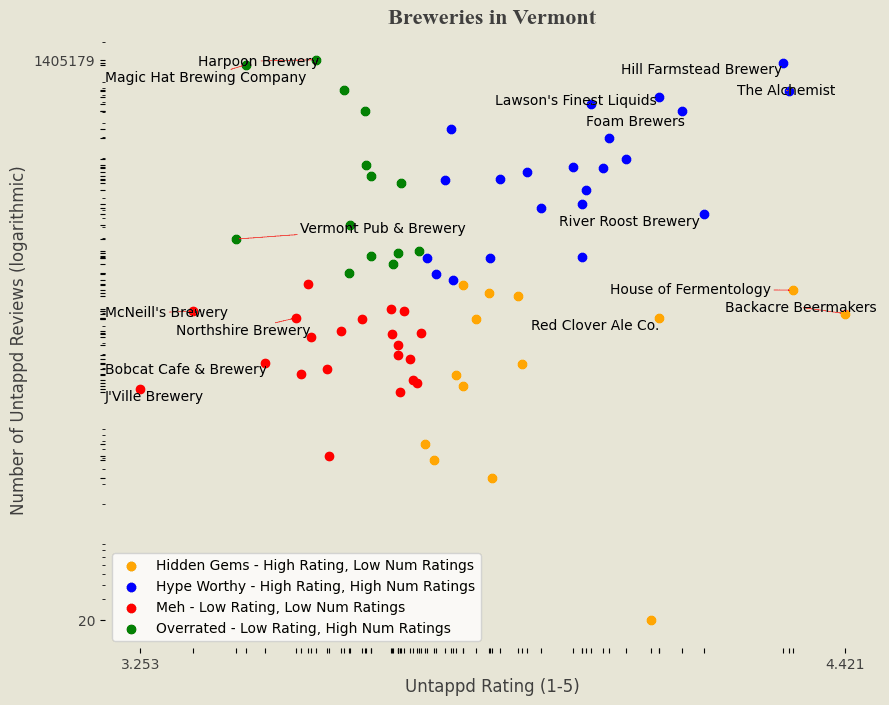
Once I had the chart, I realized that no size would make it easy to read and process: it was a very fun chart to make, but the data was probably better represented by a table!
Here are the abridged breweries in each category, sorted by rating:
| Hidden Gems (high to low) | Rating | # Reviews |
|---|---|---|
| Backacre Beermakers | 4.421 | 8929 |
| House of Fermentology | 4.335 | 14252 |
| Red Clover Ale Co. | 4.113 | 8183 |
| Wooster Bill's | 4.1 | 20 |
| Lucy & Howe Brewing Co. | 3.886 | 3294 |
| Hype Worthy (high to low) | Rating | # Reviews |
|---|---|---|
| The Alchemist | 4.328 | 754993 |
| Hill Farmstead Brewery | 4.318 | 1325612 |
| River Roost Brewery | 4.187 | 64439 |
| Foam Brewers | 4.151 | 501954 |
| Lawson's Finest Liquids | 4.113 | 664608 |
| Overrated (low to high) | Rating | # Reviews |
|---|---|---|
| Vermont Pub & Brewery | 3.412 | 39378 |
| Magic Hat Brewing Company | 3.428 | 1270738 |
| Harpoon Brewery | 3.545 | 1405179 |
| Long Trail Brewing Company | 3.591 | 769595 |
| Goodwater Brewery | 3.6 | 20231 |
| Meh (low to high) | Rating | # Reviews |
|---|---|---|
| J'Ville Brewery | 3.253 | 1972 |
| McNeill's Brewery | 3.341 | 9404 |
| Bobcat Cafe & Brewery | 3.46 | 3362 |
| Northshire Brewery | 3.511 | 8188 |
| Saint J Brewery | 3.519 | 2703 |
Full tables are available in the appendix
For those familiar with the scene, you may be wondering about some of these breweries...where are they?
First, Wooster Bill's is just not right. After a little digging, it turns out that this was from a typo! I missed a digit on Idletyme's brewery_id, and Wooster Bill's was the result. I've fixed the data since writing, but it gave me a chuckle, so I left it in.
But for the others, this was a personal choice: I left in the breweries that are no longer operational. I did this partially because some of the closed breweries still make it to the top of the "Overrated" category! J'ville, McNeill's, and Magic Hat (to name a few) are no longer producing beer.
However, if I wanted to use this data to make a list of recommendations for travelers, I would certainly want to filter those breweries out.
Heatmap: Style vs ABV
Finally, I wanted to make a heatmap of style and ABV to overall rating.
To do this, I first got the average rating of the data grouped by style and ABV. This I pivoted to give an index of style, columns of ABV category, and values of the average rating. I correlated this, plotted it on a Seaborn heatmap, and got...garbage.
The chart that resulted was unreadable: there were too many styles of beer and unique ABVs: I needed to group the data.
I went back and bucketed the beers' ABV into Low (0-5%), Medium (5-8%), High (8-10%), and Very High (10+%). More difficult would be bucketing the styles...there are a massive number of unique styles, and some defy categorization. What is a Kentucky Common?
Most of what I was curious about were basic categories: hoppy, dark, light, and sour beer. I made a map of 'style' to 'type', which took the biggest styles and gave them the appropriate type (a Pilsner is a Light beer, etc). Once categorized, the heatmap made a lot more sense:
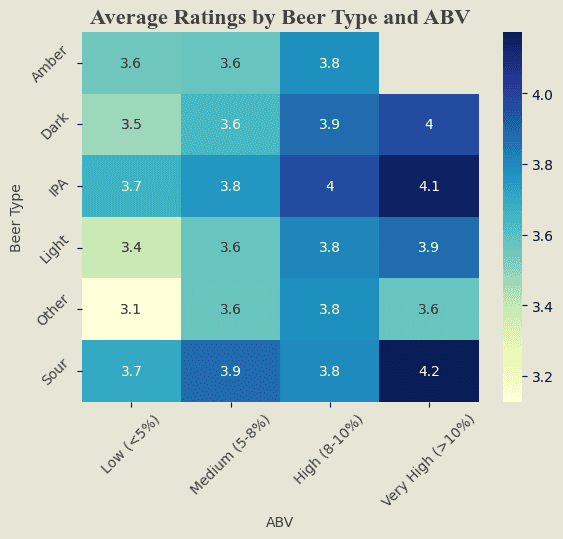
A rough picture emerged:
- IPAs and Sours were generally the highest rated categories (which we had seen in bar charts earlier)
- Very High ABV beers were the most popular in these categories (and dark beers as well), and low ABV beers generally weren't as popular
- The sweet spot across styles was 8-10% ABV, which feels about right to my gut. A double IPA is most commonly 8%, and that is a dominant style.
Future Directions
There are more data to organize and questions to answer — these are a few that I'm looking into next:
Check-in Data
There is a great deal of 'check-in' data in the initial JSON payload that I would like to unpack and parse through. Using a NLP, it would be interesting to see what sentiment looks like on comments.
Mapping
I would like to know how many check-ins happen outside of the state. What are the most popular beers outside of the state (other than Heady Topper)? Where is it most popular?
Interactivity
For so many of these charts, I want to click around on them. Building some of these charts to be interactive in a web environment would be excellent.
Conclusion (so far)
- IPAs are still generally dominant
- Sour beers are less made, but generally rated higher
- Very high ABV beers are generally rated higher
- Lists of Hidden Gems, Hypeworthy, Overrated, and Meh breweries have been created.
I'm looking forward to working more on this! You can keep an eye on the respository (linked below), my blog, or any of my socials to stay up to date.
If you have comments, questions, or errors to point out, please get in touch, I'd love to hear what you think.
Thanks for reading!
I'm currently looking for work, especially as a Data Analyst/Scientist, so please holler if you would like to connect on a project or role.
Appendix
Code
You can check out the repository here. I've included the intial JSON payload if you want to do your own work on it.
Hidden Gems
| Brewery | Rating | # Reviews |
|---|---|---|
| Backacre Beermakers | 4.421 | 8929 |
| House of Fermentology | 4.335 | 14252 |
| Red Clover Ale Co. | 4.113 | 8183 |
| Wooster Bill's | 4.1 | 20 |
| Lucy & Howe Brewing Co. | 3.886 | 3294 |
| Black Flannel Brewing | 3.879 | 12643 |
| Soulmate Brewing Company | 3.837 | 339 |
| Farnham Ale & Lager | 3.831 | 13361 |
| Weird Window Brewing | 3.809 | 8031 |
| Whirligig Brewing | 3.789 | 2121 |
| Vermont Beer Makers | 3.788 | 15738 |
| Dirt Church Brewing Co | 3.776 | 2602 |
| Kickback Brewery | 3.74 | 479 |
| Scotch Hill Brewing Co. | 3.726 | 658 |
Worth the Hype
| Brewery | Rating | # Reviews |
|---|---|---|
| The Alchemist | 4.328 | 754993 |
| Hill Farmstead Brewery | 4.318 | 1325612 |
| River Roost Brewery | 4.187 | 64439 |
| Foam Brewers | 4.151 | 501954 |
| Lawson's Finest Liquids | 4.113 | 664608 |
| Frost Beer Works | 4.058 | 192485 |
| Fiddlehead Brewing Company | 4.031 | 298087 |
| Foley Brothers Brewing | 4.021 | 161663 |
| Burlington Beer Company | 4.001 | 578840 |
| Upper Pass Beer Company | 3.992 | 104255 |
| Ten Bends Beer | 3.985 | 78639 |
| Green Empire Brewing | 3.985 | 27741 |
| Four Quarters Brewing | 3.97 | 165367 |
| Prohibition Pig | 3.918 | 73802 |
| Hermit Thrush Brewery | 3.895 | 149607 |
| 14th Star Brewing Company | 3.849 | 131685 |
| Whetstone Beer Co. | 3.833 | 27189 |
| Good Measure Brewing Co. | 3.771 | 17282 |
| Zero Gravity Craft Brewery | 3.769 | 351251 |
| Lost Nation Brewing | 3.758 | 128875 |
| Simple Roots Brewing Company | 3.743 | 19818 |
| Bent Hill Brewery | 3.729 | 27127 |
Overrated
| Brewery | Rating | # Reviews |
|---|---|---|
| Vermont Pub & Brewery | 3.412 | 39378 |
| Magic Hat Brewing Company | 3.428 | 1270738 |
| Harpoon Brewery | 3.545 | 1405179 |
| Long Trail Brewing Company | 3.591 | 769595 |
| Goodwater Brewery | 3.6 | 20231 |
| Queen City Brewery | 3.601 | 52175 |
| Otter Creek Brewing | 3.626 | 506254 |
| von Trapp Brewing | 3.627 | 173600 |
| Drop-In Brewing Company | 3.635 | 28345 |
| Switchback Brewing Company | 3.635 | 139258 |
| Madison Brewing Company | 3.672 | 23972 |
| Stone Corral | 3.68 | 29899 |
| Rock Art Brewery | 3.686 | 119613 |
| Rutland Beer Works | 3.715 | 30916 |
Meh
| Brewery | Rating | # Reviews |
|---|---|---|
| J'Ville Brewery | 3.253 | 1972 |
| McNeill's Brewery | 3.341 | 9404 |
| Bobcat Cafe & Brewery | 3.46 | 3362 |
| Northshire Brewery | 3.511 | 8188 |
| Saint J Brewery | 3.519 | 2703 |
| Trout River Brewing Company | 3.532 | 16152 |
| Jasper Murdock's Alehouse | 3.536 | 5575 |
| Brewster River Pub & Brewery | 3.563 | 2973 |
| Dog River Brewery | 3.566 | 524 |
| Kingdom Brewing | 3.586 | 6260 |
| Outer Limits Brewing | 3.621 | 7969 |
| 1st Republic Brewing Co. | 3.669 | 9874 |
| Halyard Brewing Company | 3.67 | 5967 |
| Hired Hand Brewing Company | 3.681 | 3909 |
| Hogback Mountain Brewing | 3.681 | 4804 |
| Next Trick Brewing | 3.684 | 1867 |
| Mill River Brewing | 3.69 | 9413 |
| Beer Naked Brewery | 3.7 | 3630 |
| Brocklebank Craft Brewing | 3.706 | 2381 |
| Two Heroes Brewery | 3.712 | 2246 |
| Red Barn Brewing | 3.718 | 6107 |